Dashboards
Interactive dashboards by Daniel Sánchez Pazmiño, including an Ecuador seismic activity dashboard plus Power BI economic dashboards from Natural Resources Canada and the Government of Alberta.
Business intelligence dashboards and sector profiles built with Power BI, plus a couple of custom-built interactive tools.
Sismicidad Ecuador: Seismic Activity Dashboard
A self-contained, interactive console tracking seismic activity in Ecuador, hand-built in HTML, SVG, and JavaScript with no external libraries or backend. Built as a showcase of EcuDataMCP, the MCP server I co-built for Ecuadorian open data — the dashboard’s events come straight from it: a snapshot of Ecuador’s Instituto Geofísico (IG-EPN) feed covering 18 July to 16 August 2026. Plotted against real provincial and cantonal boundaries from geoBoundaries (CC0). Built with Claude Code.
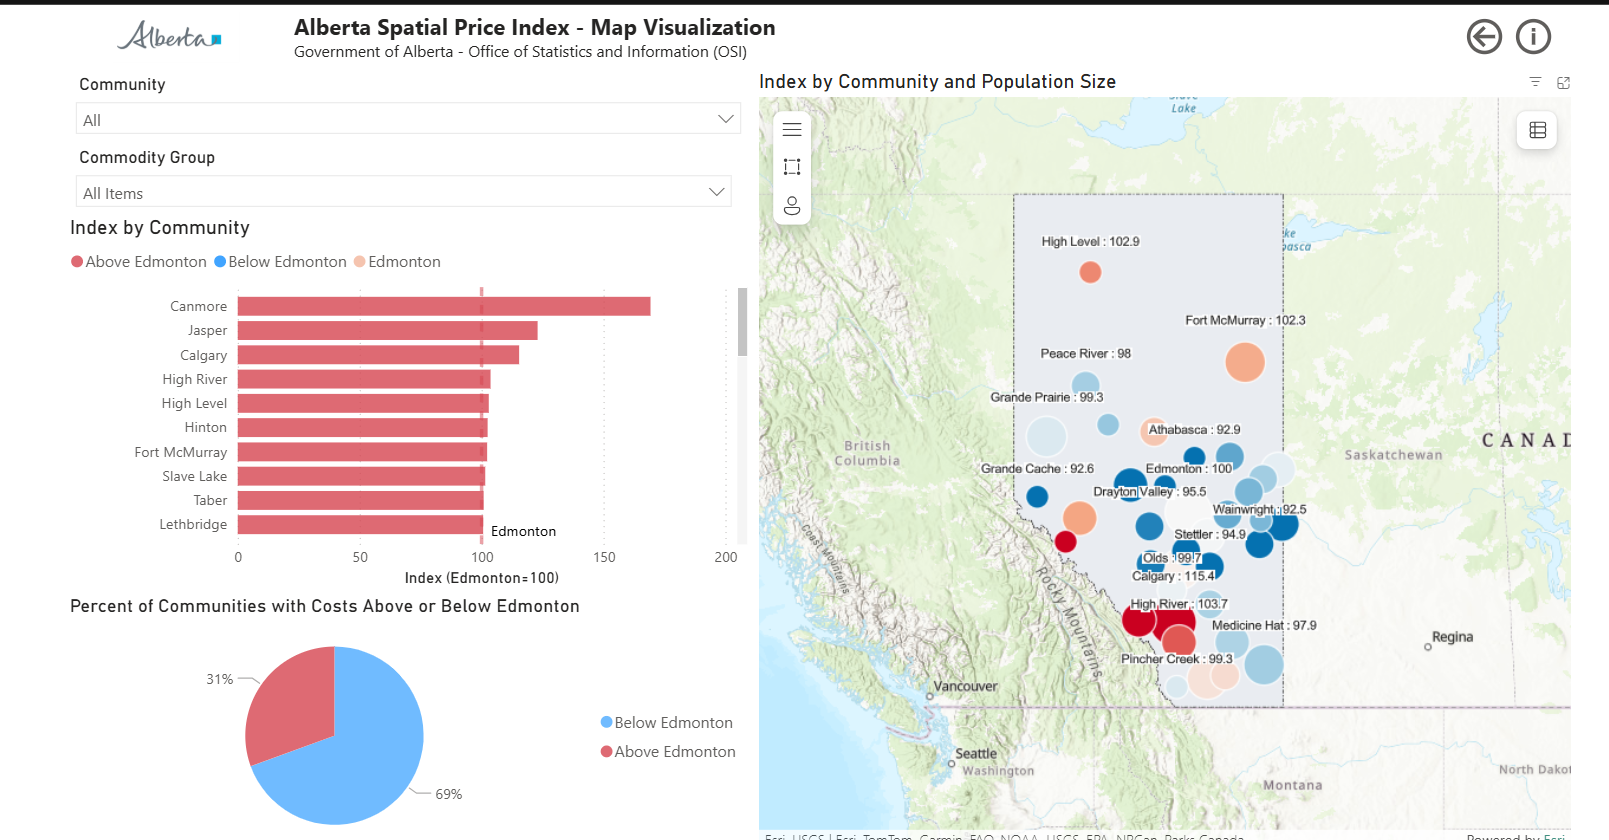
Alberta Spatial Price Index Dashboard
This dashboard was developed during my time at the Office of Statistics and Information, as a team effort. It visualizes the spatial price index for Alberta, which is a measure of the relative cost of living across different regions in the province, relative to Edmonton.
Superstore Delivery Time Analytics
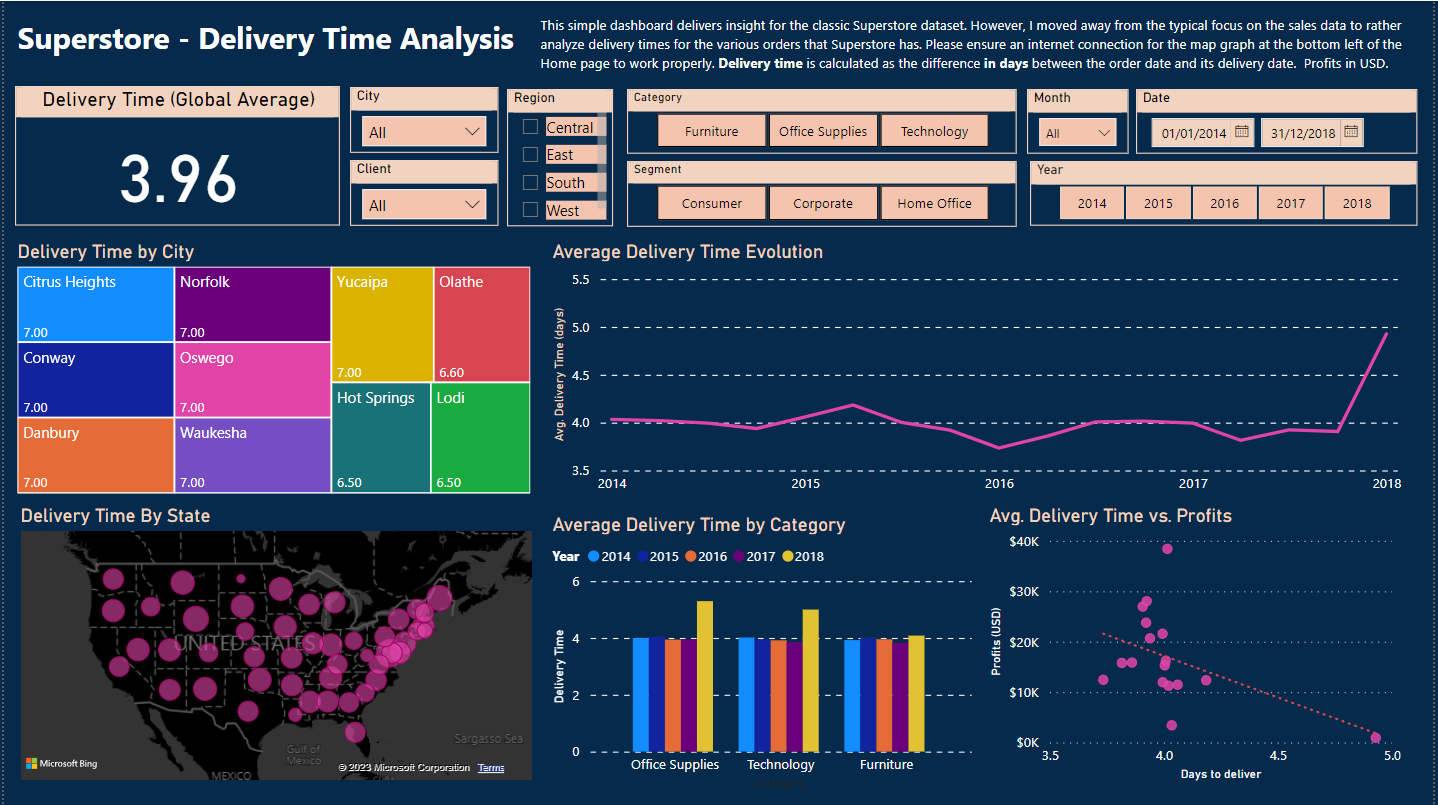
I give the classic Superstore dataset a twist by analyzing delivery times instead of sales in this Power BI dashboard. Be sure to turn on maps from your security options in Power BI desktop to see the full functionality of the file.
Ecuador en la Encrucijada: Shiny App
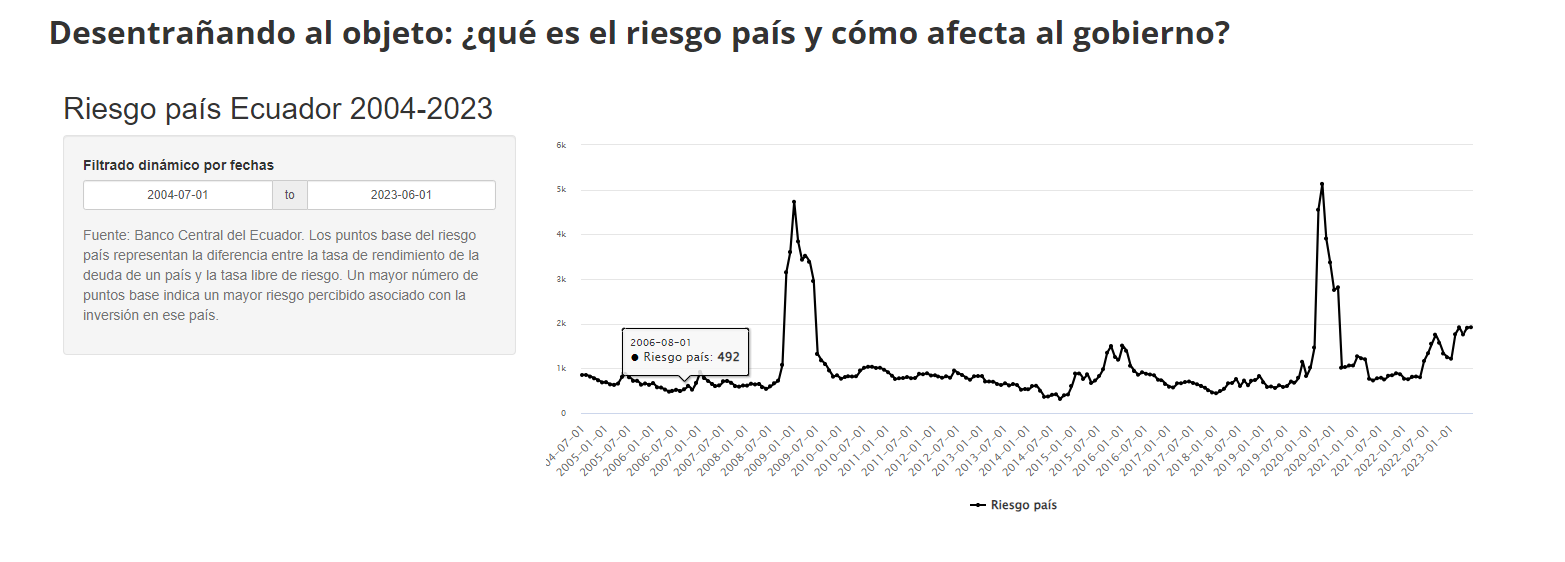
An interactive Shiny app built for El Quantificador, the data journalism blog of the Ecuadorian Development Research Lab (LIDE). The app allows users to explore macroeconomic indicators for Ecuador interactively.
Clean technology companies in Canada
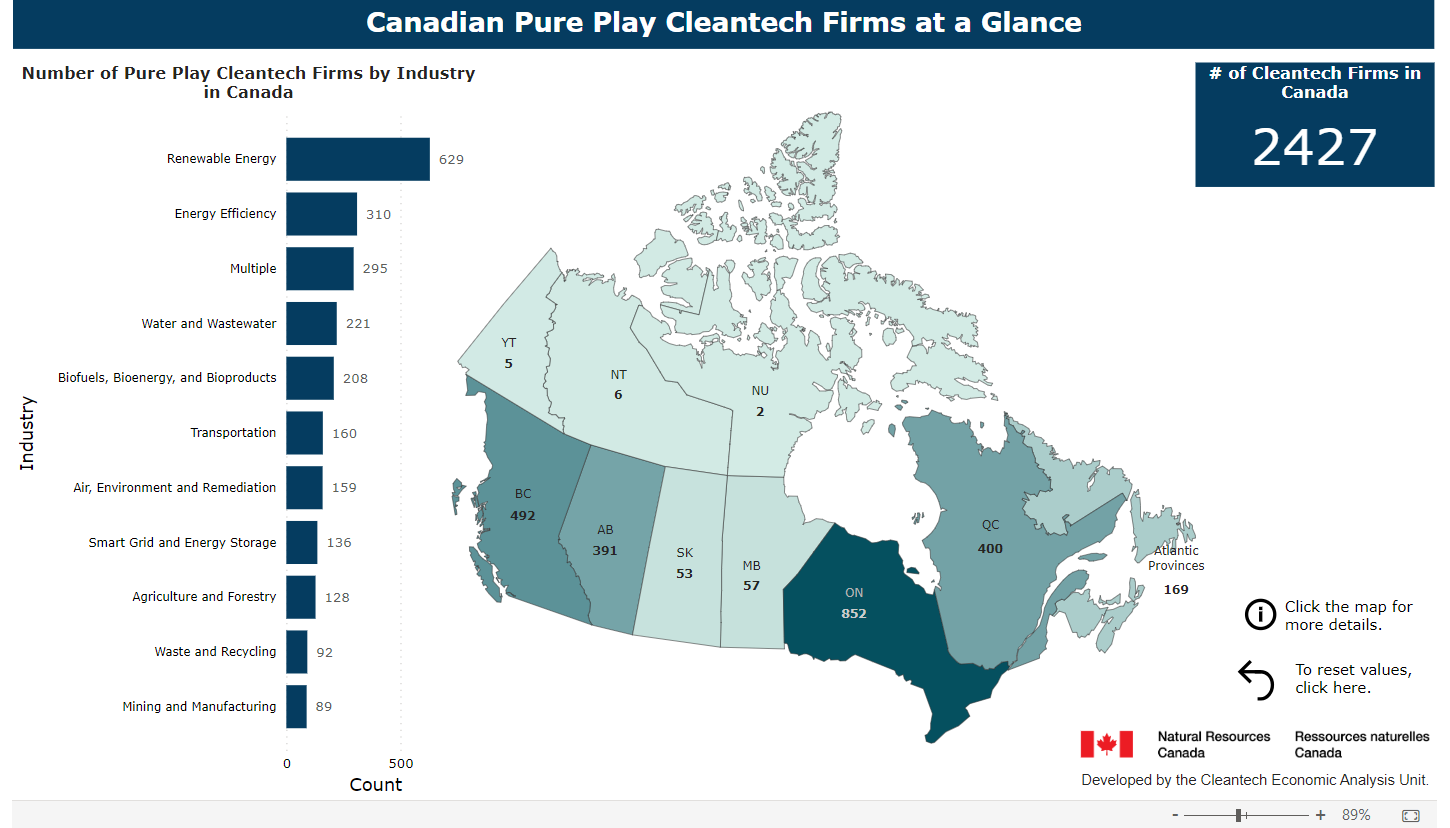
This is a series of work produced during my time as a Junior Economist (Co-op) in the Clean Technology Economic Analysis Unit team at Natural Resources Canada, which I cannot claim as mine but part of a team effort of highly skilled professionals in NRCan. ### Canadian Pureplay Clean Technology Companies Dashboard
A Power BI Dashboard that visualizes the number of Canadian pureplay clean technology companies across provinces and subindustries in the country.
Footnotes
It is not possible to openly deploy Power BI dashboards as it is on Tableau or Shiny. However, to visualize this dashboard you only need to download Power BI desktop on your computer, which is free. The only issue is that it is only available for Windows.↩︎